Introduction
National Maternity Voices (NMV) first undertook a demographic survey of MVP chairs & co-chairs in 2020. The maternity & neonatal programme team at NHS England requested an update in the summer of 2023. Most questions were kept the same and new questions were added about baby loss and deprivation.
Results summary
The survey had a good response rate from every NHS region. About two thirds of all MNVP leads/chairs completed the survey. 137 responses were received in total including 30 vice chairs and other members of the MVP team.
Some characteristics were similarly distributed amongst respondents and service users (based on recent NHS England data2):
- ethnicity
- health limitations
- experience of neonatal care
However, the following characteristics differed, respondents are:
- older
- more likely to be neurodivergent
- less likely to be single parents
- more likely to have experienced loss
- less likely to live in more deprived areas, though over half work or volunteer frequently in a deprived area.
The survey also found that a majority of respondents have primary school age children and over 60% have preschool children. A third of respondents have additional caring responsibilities: more than women 18-44 in the general population, but they are less likely to be doing more than 20 hours a week.
Compared to responses from chairs in 2020, more respondents are from ethnic minority groups, they are slightly younger, have younger children, and fewer are single parents.
Privacy: The MNVP leaders network is a relatively small group of about 200 people and safeguarding privacy was important. NMV engaged someone with no personal knowledge of MNVP leaders to run the survey and process the data. (Amira Glaze, an engineering undergraduate). Responses to questions were not sub-analysed e.g. by region, apart from the role of respondents. Free format responses were themed by Amira rather than quoted.
Data Analysis: For each question the prefer not to answer/don’t know/did not answer response rate is quoted as a percentage. All other responses were totalled and percentages quoted exclude those who did not answer. Percentages are given as whole numbers, so in some cases they may not add to 100. Comparative data is used throughout the report to represent the service users e.g. the percentage of March 2023 births to people living in each deprivation decile. A list of sources is given at the end of the report. Statistical interpretation was undertaken by Louise Griew, who has a maths degree.
Please note that it is possible that some (unknown) bias exists in whether leads responded or not, so it cannot be assumed that respondents are representative of all MNVP leads.
Responses
The survey link was emailed to MNVP leads on 1st July and then again on 3rd August. It was also emailed to regional service user voice reps, posted on the NMV Facebook groups multiple times, and mentioned on the maternity hub on NHS futures. Overall, there were 137 responses between the start date (01/07/23) and the end date (15/08/23).
Role: We asked “What is your role within the MNVP/MVP?” All participants answered this question.
| Role | Number | Percentage |
| Lead, chair, or co-chair | 107 | 78% |
| ‘Vice or Deputy chair or other member of the leadership team | 16 | 12% |
| Other | 14 | 10% |
Region: We asked “In which NHS Region is your MNVP?”
1% of respondents selected prefer not to answer/don’t know. All Regions were well represented and the survey was kept open until approximately 50% of total known chairs/leads in each region had responded.
Table 1: Location of responses compared to data from the MVP Map1.
| Regions | All survey responses | Lead/Chair responses | Leaders on NMV database July 23 |
| North East & Yorkshire | 25% | 22% | 23% |
| North West | 10% | 11% | 11% |
| Midlands | 13% | 11% | 11% |
| East | 9% | 10% | 14% |
| South west | 8% | 9% | 5% |
| London | 15% | 15% | 18% |
| South east | 21% | 20% | 16% |
Demography
Ethnicity: 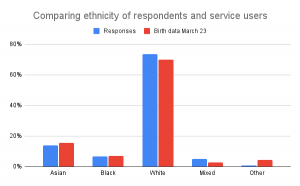
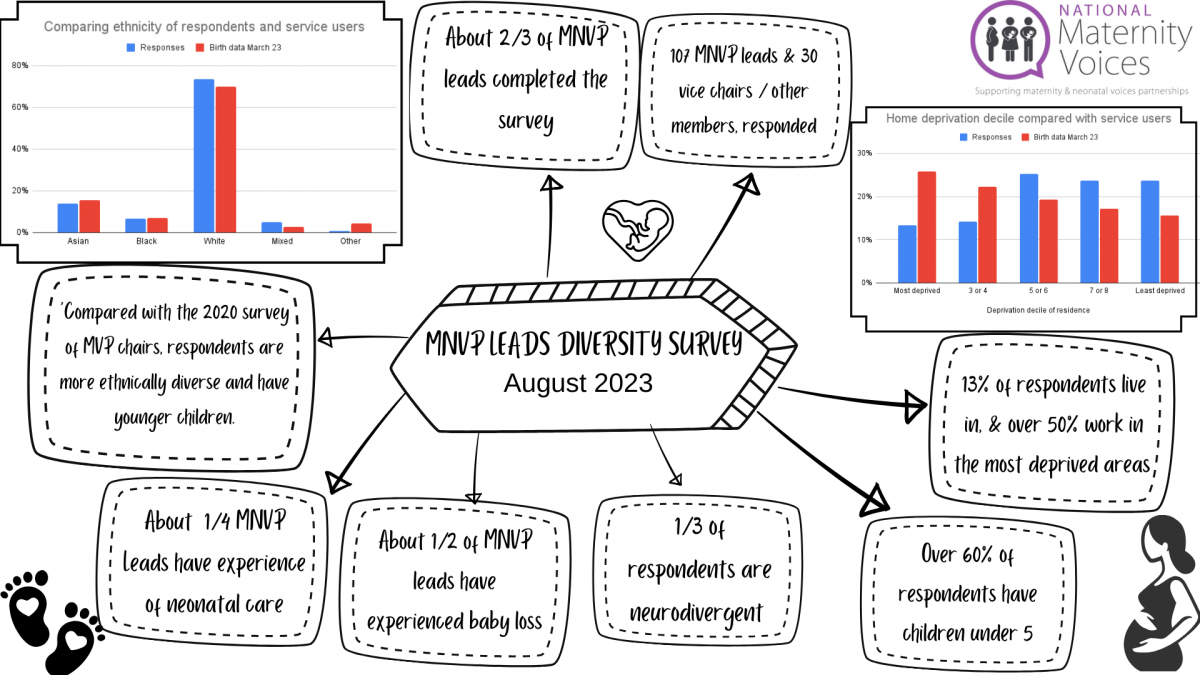
We asked “What is your ethnicity?” and got free format responses. For analysis, responses were compiled into the categories that are used in the maternity data2: Asian or Asian British, Black or Black British, White, Mixed and any other ethnic group.
1% selected prefer not to answer. The responses show a spread of ethnicities quite similar to those of recent service users 2, and with an increase in respondents from ethnic minority backgrounds compared to the 2020 Chair survey data9.
Table 2: Ethnicity responses compared to national birth data (March 2023)2
| Ethnicities | All survey responses | Lead/Chair responses | Birth Data2 | 2020 Chair responses9 |
| Asian or Asian British | 14% | 12% | 15.7% | 5% |
| Black or Black British | 7% | 7% | 7.0% | 4% |
| White (any) | 74% | 76% | 70.0% | 87% |
| Mixed | 5% | 6% | 2.8% | 3% |
| Any other ethnic group | 1% | 0% | 4.5% | 1% |
Comparative data: NHS England’s Maternity Services Monthly Statistics, March 20232
Age: 2% of respondents selected prefer not to answer. Given that chairs are service users their first experience of the maternity service can be expected to be at least a year ago. We are therefore comparing the age of chairs with the age group at booking who are 5 years younger. Even so MNVP leaders tend to be older than service users. However, there has been some increase in younger leaders from 2020.
Table 3: Age of respondents compared to national data for age2 of booking
| Age | Age of respondents | Lead/Chair Age | National data2 (age at booking) | 2020 Chair responses9 |
| Under 30 | 7% | 8% | 15.3% (Under 25) | 3% |
| 30-45 | 76% | 75% | 80.2% (25-39) | 82% |
| Over 45 | 17% | 17% | 4.5% (Over 40) | 15% |
Health/disability: We asked “Are your day-to-day activities limited because of a physical or mental health problem or disability which has lasted, or is expected to last, at least 12 months?”
3% preferred not to answer. Those who did answer gave a spread of responses similar to the 2021 census responses for females 20-44
Table 4: Limitations due to health responses compared to Census 2021 data3
| Limitations due to health | Survey responses | Lead/Chair responses | Disability for females 20 – 44 in England ³ | 2020 Chair responses9 |
| No | 87% | 88% | 86.0% | 79% |
| Yes – limited a little | 9% | 9% | 9.7% | 19% |
| Yes – limited a lot | 4% | 3% | 4.3% | 1% |
Census 2021³ (not quite the same question)
Neurodiversity: 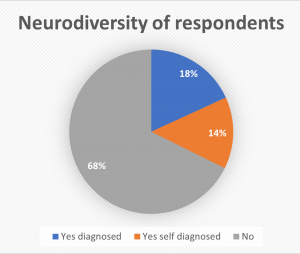
We asked: “Are you neurodiverse? (For example, autistic, ADHD, dyslexic, dyspraxic, OCD, Tourettes)”
9% opted to not answer or selected prefer not to answer. Out of the remaining respondents a third said they were neurodiverse (18% diagnosed and 15% self diagnosed). This is high compared to local government data⁴ which suggests 15% of people are neurodiverse including around 10% being dyslexic. In 2020 17% of chairs said they were neurodiverse.
27% of respondents stated their neurodiversity: ADHD (attention deficit hyperactivity disorder) was most frequently mentioned, with autism and dyslexia also common.
Pregnancy and parenthood: 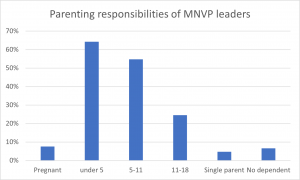
We asked respondents to select all responses that applied. 1% of respondents preferred not to answer. A majority of respondents have primary school age children and over 60% have preschool children. Overall 93% of leads responding have dependent children. 5% of leads responding are single parents compared to 15% of families in ONS statistics 5.
Table 6: Parenthood responses compared to 2020 survey
| Pregnancy and parenthood | Survey responses | Lead/Chair responses | 2020 Chair responses9 |
| Currently pregnant | 7% | 8% | 4% |
| 1 or more children under 5 | 62% | 64% | 56% |
| 1 or more children 5 -11 | 54% | 55% | 58% |
| 1 or more children 11-18 | 25% | 25% | 28% |
| Single parent household with dependent children | 4% | 5% | 9% |
| 1 or more adult children | 11% | 9% | Not asked |
| None | 2% | 1% | Not asked |
| No dependant children | 8% | 7% | 6% |
Neonatal Experience:
We asked: “Have you had a baby in neonatal care (NICU or SCBU)?” 2% of respondents selected prefer not to answer. About a quarter responded that they had which is the same as in 2020. This is what would be expected if each had experienced 2 pregnancies based on 1 in 7 babies spending time in neonatal care6.
Table 7: Survey responses for neonatal care
| Experienced neonatal care | Survey responses | Lead/Chair responses | 2020 Chair responses9 |
| No | 76% | 74% | 73% |
| Yes | 24% | 26% | 27% |
Loss:
We asked: “Have you ever had a pregnancy loss or a baby that died within a year of birth?” 3% of respondents preferred not to answer. Out of the remaining respondents just under half selected yes. NHS data 7 is 1 in 8 (12.5%) known pregnancies will end in miscarriage so with 3 pregnancies 37% might be expected to experience loss. The rate of loss amongst respondents is therefore higher than service users in general.
Table 8: Survey responses for loss of a baby
| Loss | Survey responses | Lead/Chair responses |
| No | 54% | 52% |
| Yes | 46% | 48% |
Caring: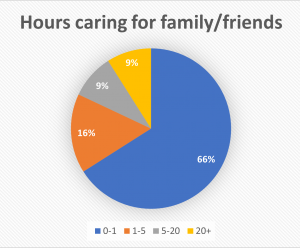
We asked: “How many hours do you spend giving support to family or friends because of long-term physical or mental ill-health / disability or problems related to old age?”
7% of participants selected prefer not to answer. About a third of respondents have caring responsibilities. The ONS data 8 uses different divisions of hours. The data suggests that respondents are more likely to spend 1-20 hours a week on caring, and less likely to spend over 20 hours a week caring, than women of childbearing age in the general population.
Table 9: Caring responsibilities compared to ONS data8
| Caring responsibilities | Survey responses | Lead/Chair responses | 2020 Chair responses | Caring hours females 18-44 8 |
| 0 to 1 hour a week | 66% | 67% | 68% | 78.4% |
| 1-5 hours a week | 16% | 15% | 17% | 2.6% (1-9 hrs) |
| 5-20 hours a week | 9% | 10% | 10% | 1.0% (10-20 hrs) |
| Over 20 hours a week | 9% | 9% | 5% | 18.1% |
Comparative Data: Office of National statistics: Unpaid care by age, sex 2021
Deprivation: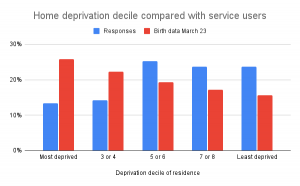
We asked: “Please look up the degree of deprivation in the area you live on this checker GB Postcode Deprivation Finder (alasdairrae.github.io) and tell us in which decile you live?”
7.3% of respondents selected unsure or prefer not to answer. This question was not asked in 2020 and was added because of the known association between deprivation and poorer outcomes. (MBRRACE reports) Comparison is made with service users who gave birth in March 2023.
Table 10: Deprivation decile respondents live in compared to national data²
| Deprivation decile | Survey responses | Lead/Chair responses | National Birth Data2 |
|---|---|---|---|
| Most deprived (1 or 2) | 13% | 11% | 25.8% |
| 3rd or 4th decile | 14% | 13% | 22.3% |
| 5th or 6th decile | 25% | 28% | 19.3% |
| 7th or 8th decile | 24% | 21% | 17.2% |
| Least deprived (9 or 10) | 24% | 27% | 15.6% |
Comparative data: NHS England’s Maternity Services Monthly Statistics, March 2023
We also asked: “Do you work or volunteer in any capacity at least once a month in one of the 20% most deprived areas? (coloured red on this map ICDRC Mapmaker: Deprivation Indices (IMD) (CDRC Harmonised 2019 IMD))?”
21.2% of respondents selected either ‘unsure or ‘prefer not to answer’. For the remaining respondents, 58% selected yes.
Respondents are more likely to live in less deprived areas, though about a third live in the more deprived areas, and more than half regularly work or volunteer in the most deprived areas.
Reference sources of comparative data
- For numbers of MNVP leads in each Region:
National Maternity Voices MVP map/database as at July 2023 (since updated)
2. For ethnicity, age and deprivation: NHS England Maternity services data set March 2023 (service users giving birth in March)
https://digital.nhs.uk/data-and-information/publications/statistical/maternity-services-monthly-statistics/march-2023-experimental-statistics#publication-data-files-and-suppression-methodology
3. For health, census data from ONS:
Disability by age, sex and deprivation, England and Wales – Office for National Statistics (ons.gov.uk)
4. For neurodiversity:’it is estimated that around one in seven people (more than 15 percent of people in the UK) are neurodivergent’
https://www.local.gov.uk/lga-libdem-group/our-press-releases/neurodiversity
5. For prevalence of single parents: ONS data
https://www.ons.gov.uk/peoplepopulationandcommunity/birthsdeathsandmarriages/families
6. For prevalence of neonatal care: 1 in 7 babies, Bliss website:
https://www.bliss.org.uk/research-campaigns/neonatal-care-statistics/statistics-about-neonatal-care
7. For prevalence of baby loss: ‘Among people who know they’re pregnant, it’s estimated about 1 in 8 pregnancies will end in miscarriage.’ https://www.nhs.uk/conditions/miscarriage/
8. For caring responsibilities, ONS data:
https://www.ons.gov.uk/peoplepopulationandcommunity/healthandsocialcare/socialcare/articles/unpaidcarebyagesexanddeprivationenglandandwales/census2021#unpaid-care-by-age-sex-and-geography-2021
9. 2020 survey of MVP Chairs:
https://nationalmaternityvoices.org.uk/diversity-survey-mvp-chairs-sept-2020/
Acknowledgements
We are grateful to the following for their help in creating, disseminating and responding to the survey: MNVP leaders and supports, regional service user reps, the chair that gave feedback about the loss question, NHS staff who helped to promote it, Amira Glaze.